How SCOUTS-violins works
About SCOUTS-violins
SCOUTS-violins was designed as an exploratory interface through which users can visualize the results from a SCOUTS analysis.
Note that some options in SCOUTS-violins may result in errors, depending on how you chose to use SCOUTS - e.g. you can’t inspect non-outliers or OutR outliers if you did not select those rules when running SCOUTS.
Page elements
This section explains what every button and option of the SCOUTS-violins interface does.
Main window
These are the elements of the main window:
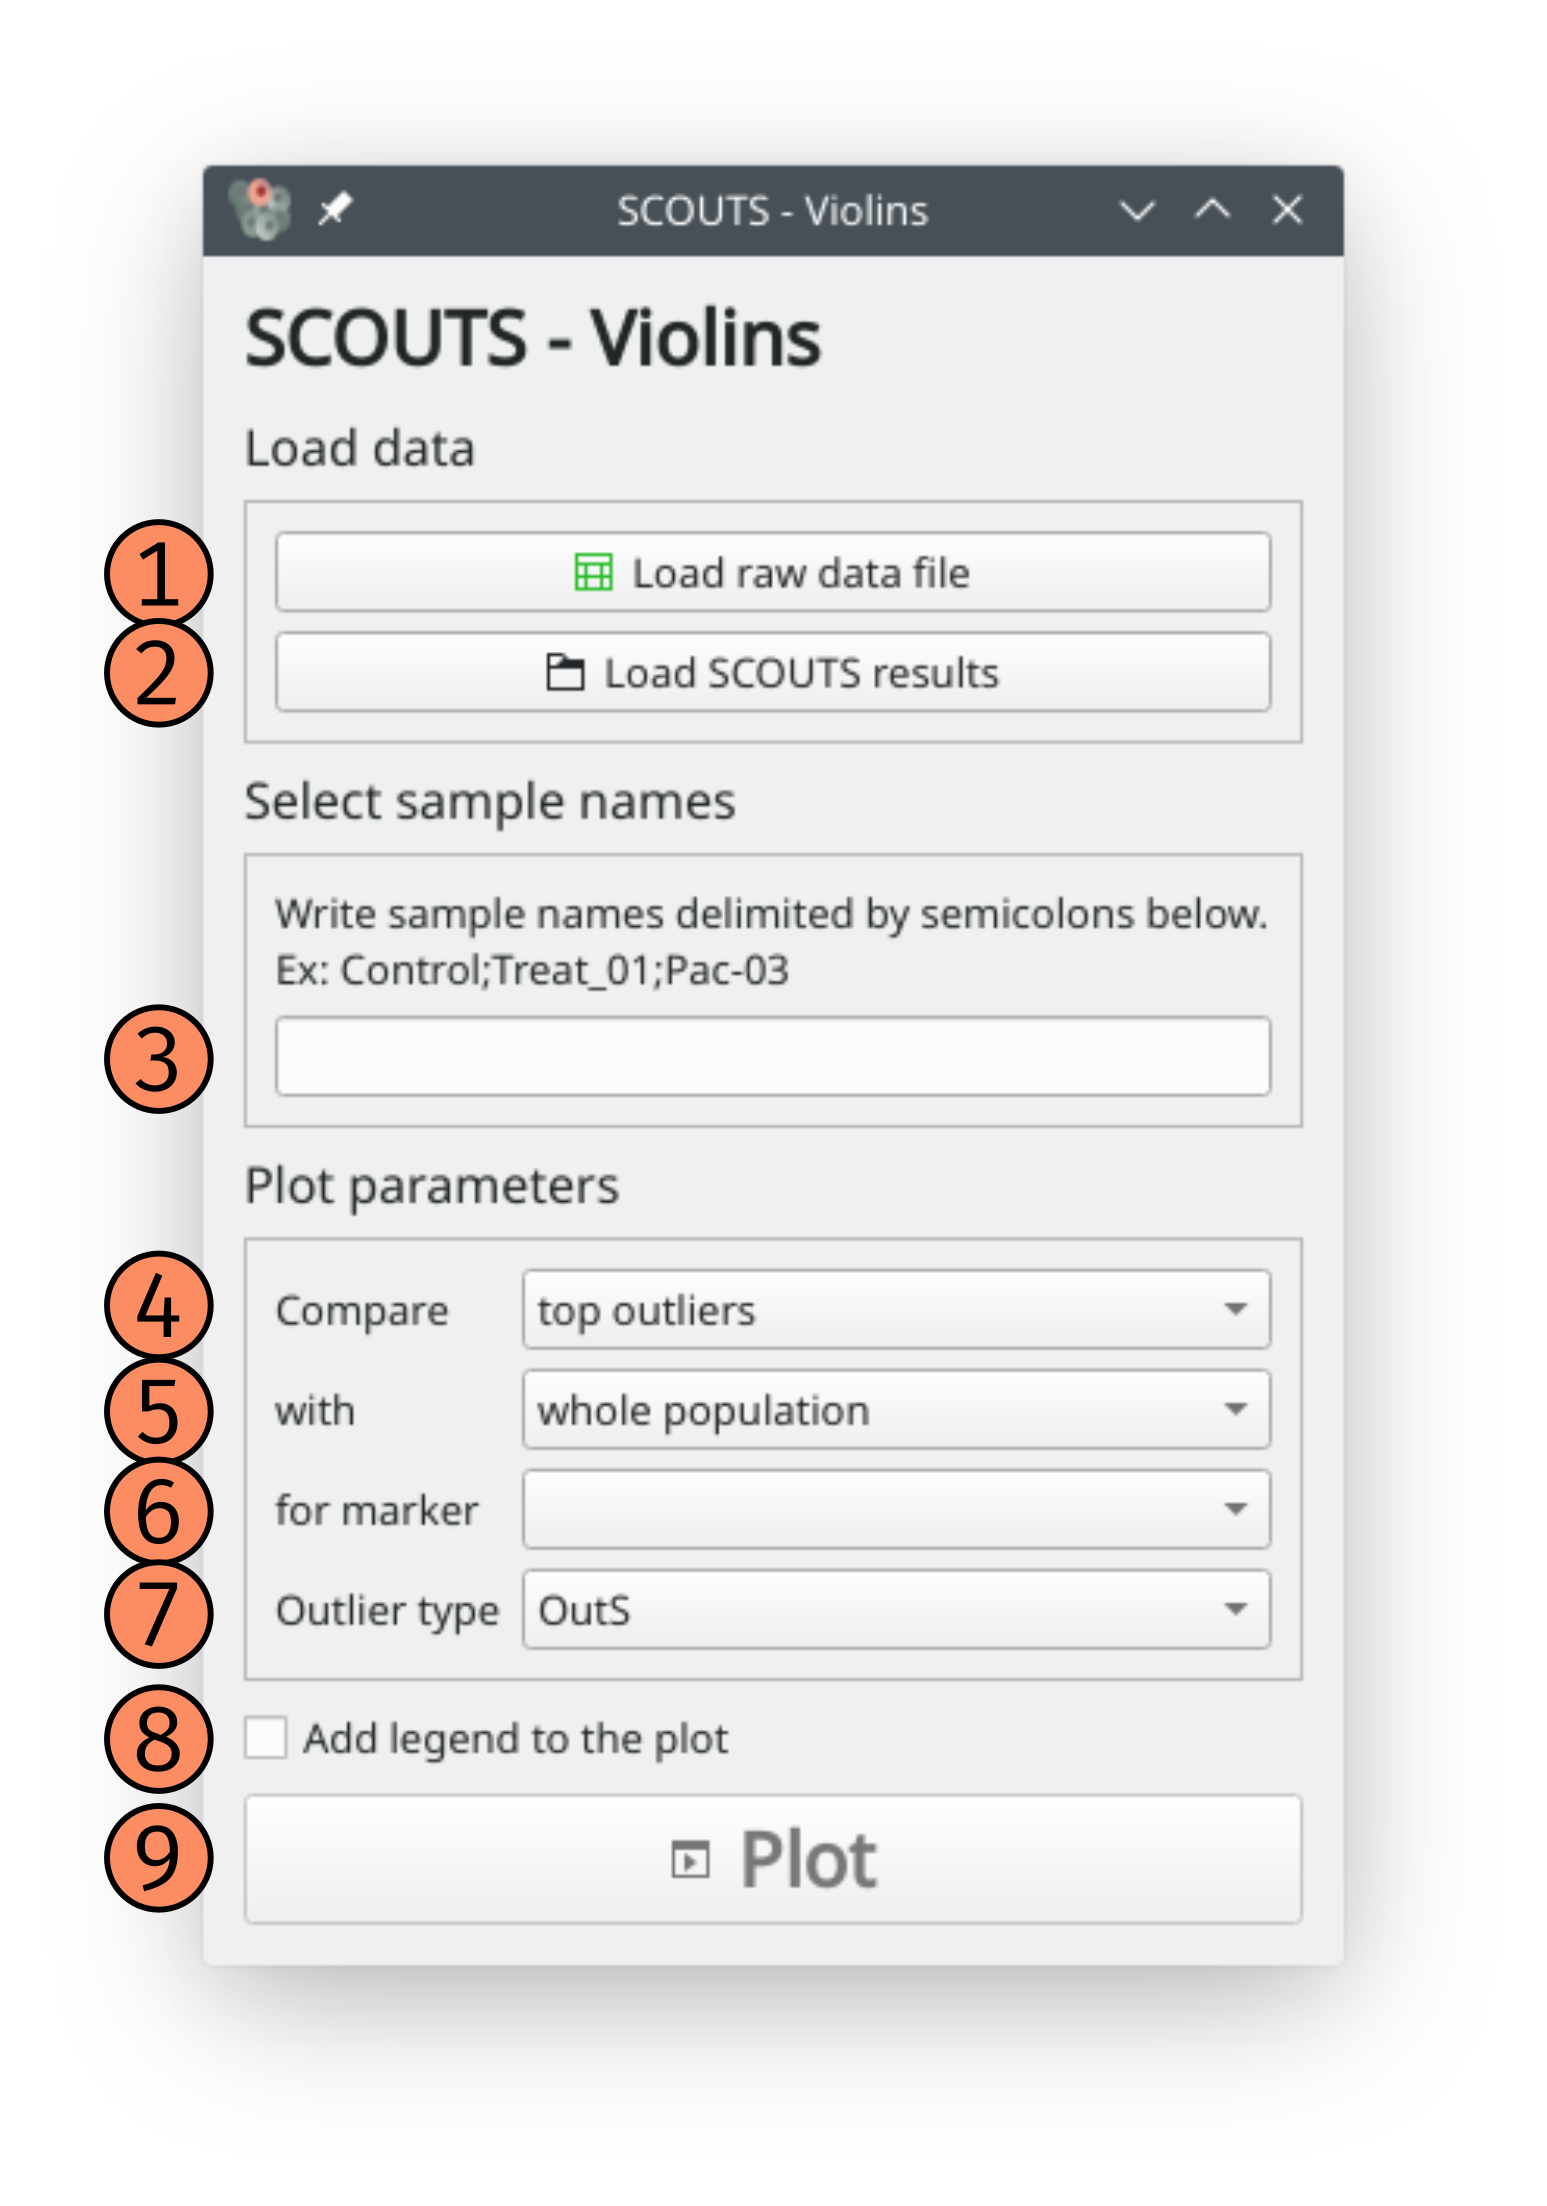
1) Load raw data: Select the same input file given to SCOUTS.
2) Load SCOUTS results: Select the same output folder used to save SCOUTS results.
3) Select sample names: Write sample names to plot, separated by semicolons (e.g. “control;patient;drug01”).
4) and 5) Populations to compare: Select populations to compare on the violin plot. The population in the top selection box appears below the population in the bottom box.
6) Marker: Select marker for which to compare populations. Markers are automatically loaded from the input file header.
7) Outlier type: select whether to plot OutS or OutR outliers.
8) Legend: Whether do display a legend in the figure.
9) Plot: click here to plot the figure with the selected parameters. The figure opens in a separate window, and can be reloaded with new parameters by clicking again on this button.
Plot window
This is the plot window:
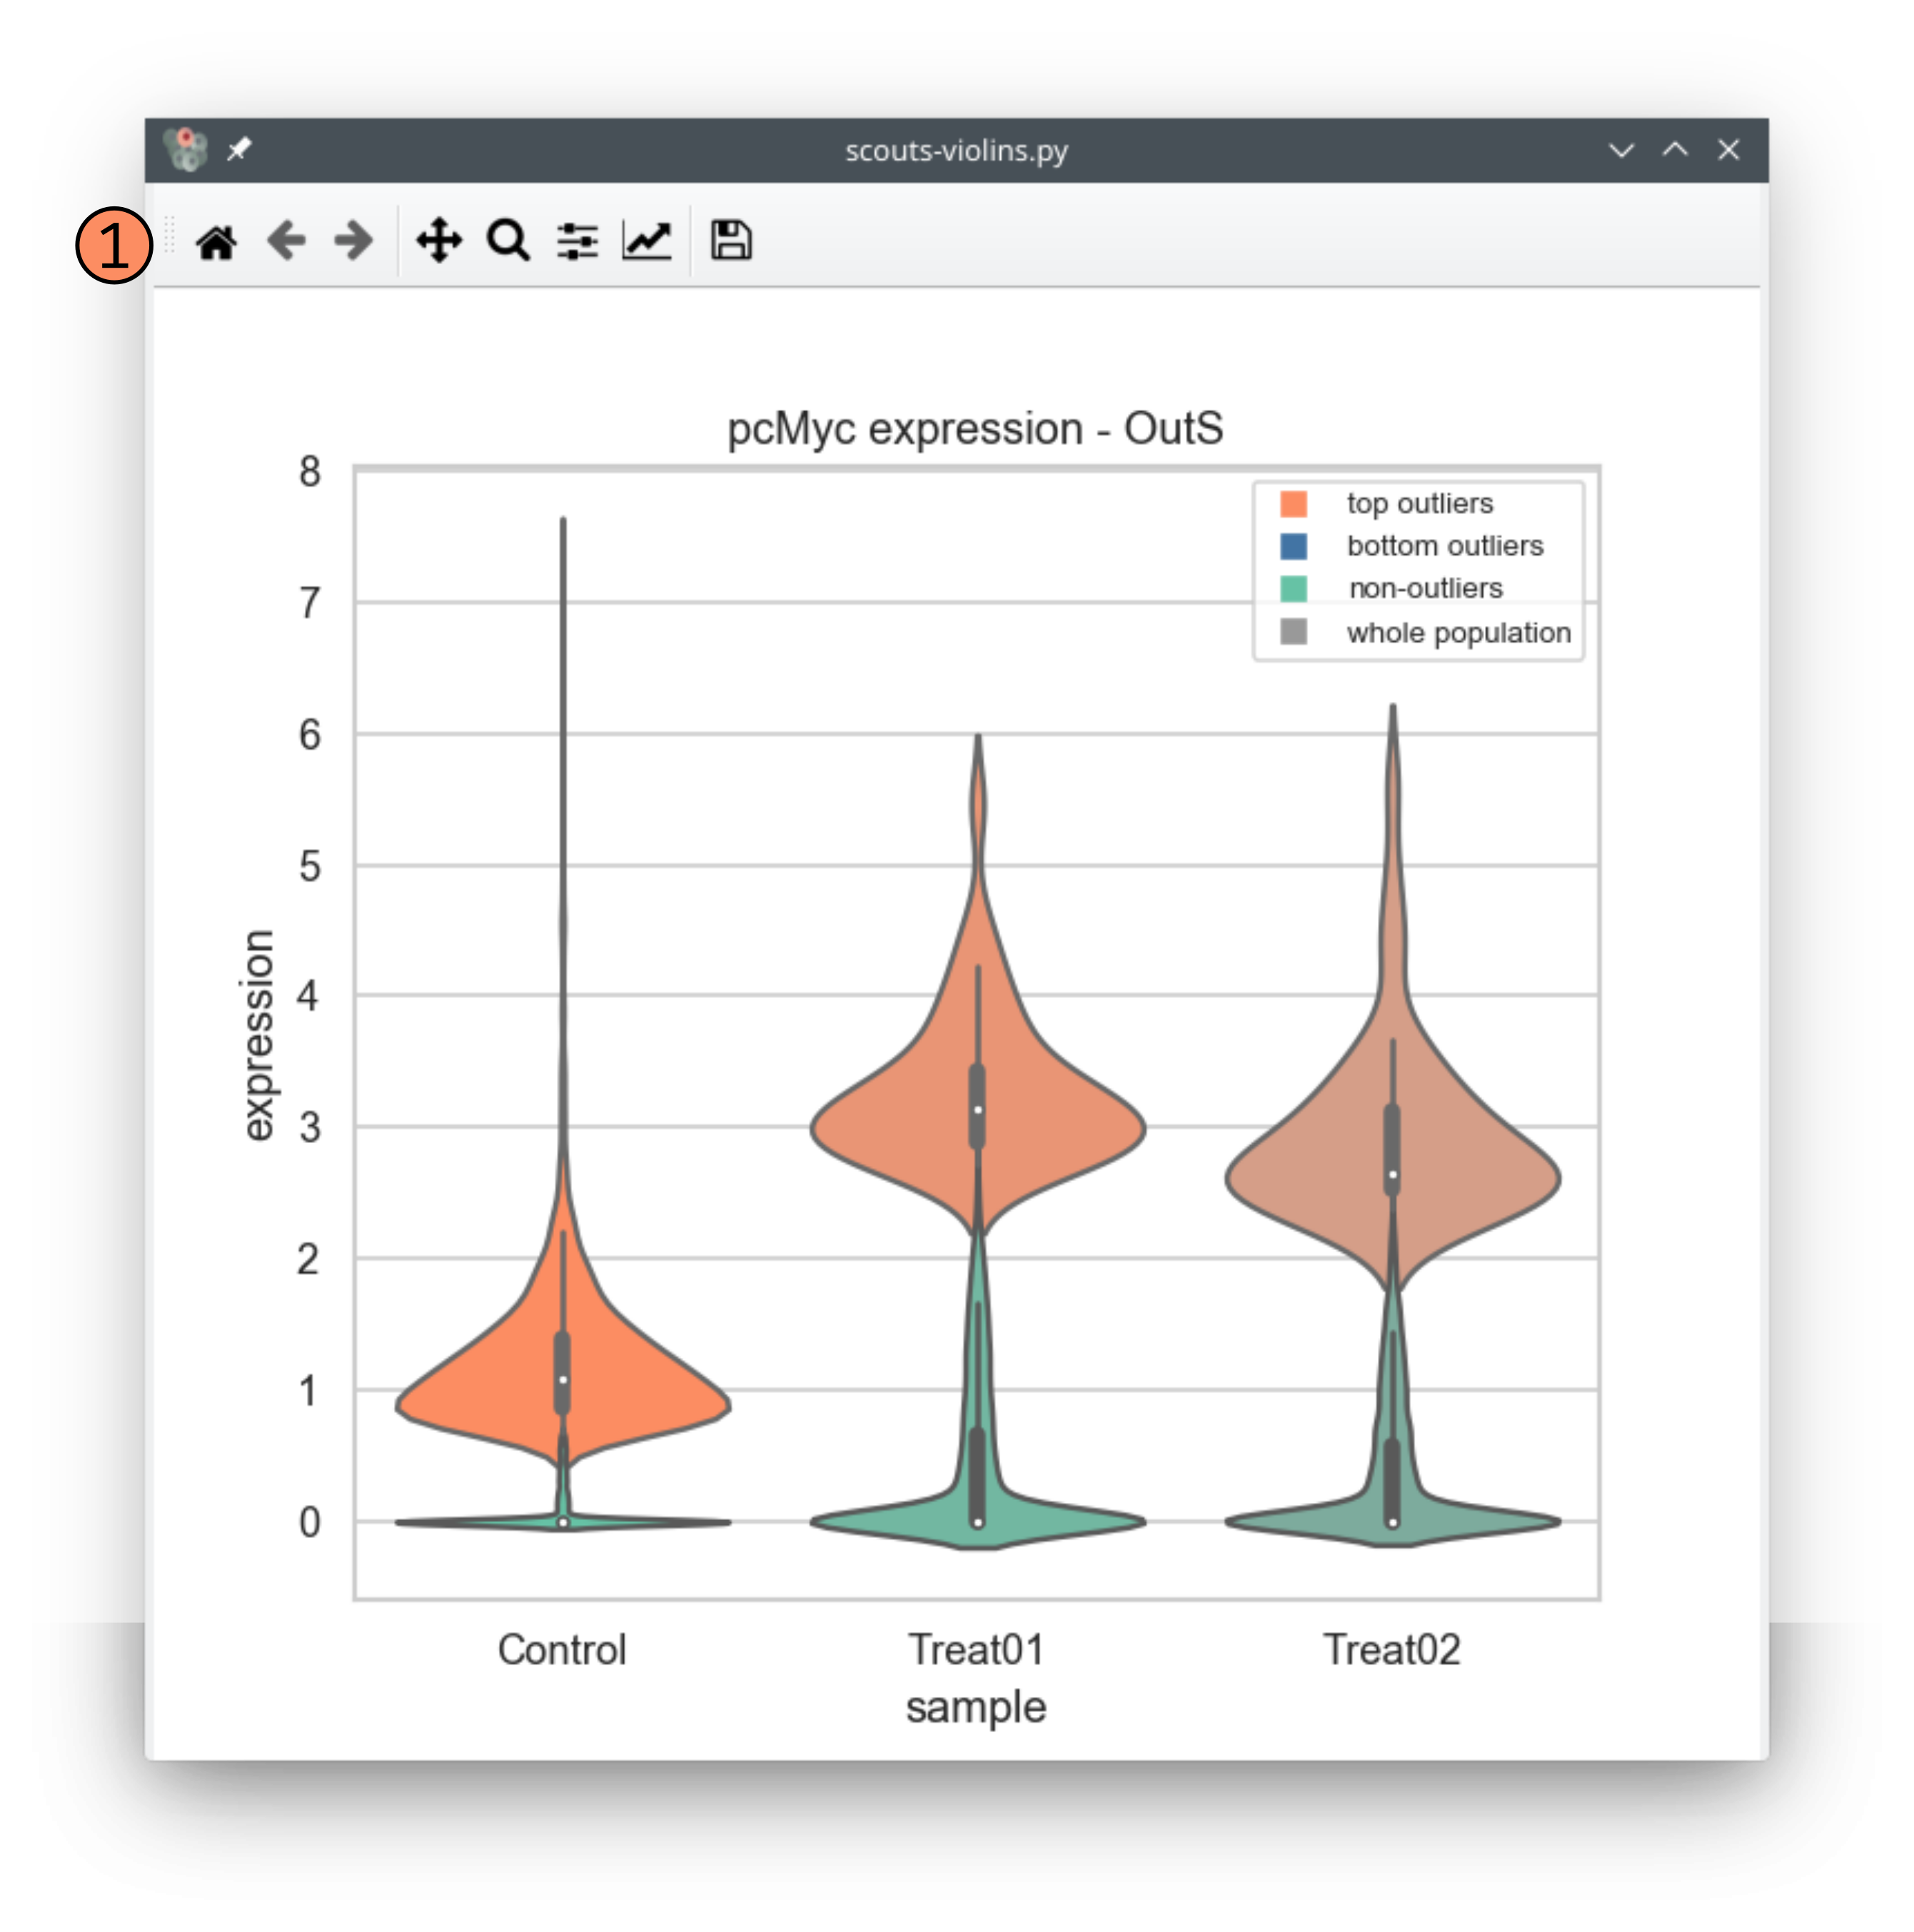
The plot window works like a regular matplotlib figure window - it can be stretched, edited and modified. You can also use the tool bar at the top (1) to zoom, move and export the plot in different formats.